Introduction
We're excited to announce the official integration of Better Stack with Shuttle! This new integration makes it easier than ever to export your metrics from Shuttle to Better Stack, allowing you to gain real-time insights into the performance of your applications. Whether you're monitoring system health, analyzing traffic patterns, or troubleshooting issues, Better Stack's powerful visualization tools combined with Shuttle’s seamless metrics export will empower you to stay on top of your project’s observability like never before. In this article, we'll guide you through the simple setup process to start leveraging this integration today.
Getting set up
To get started, you’ll need two things:
- A BetterStack account. If you don’t have one, you can sign up here.
- A Shuttle project you’d like to add telemetry to (or a new project).
Note that once you add the BetterStack integration, you’ll need to re-deploy your project. If you haven’t deployed your project before, you can just deploy it and it’ll have BetterStack telemetry (if you’ve enabled the BetterStack integration prior to deploying for the first time).
Adding a new telemetry source
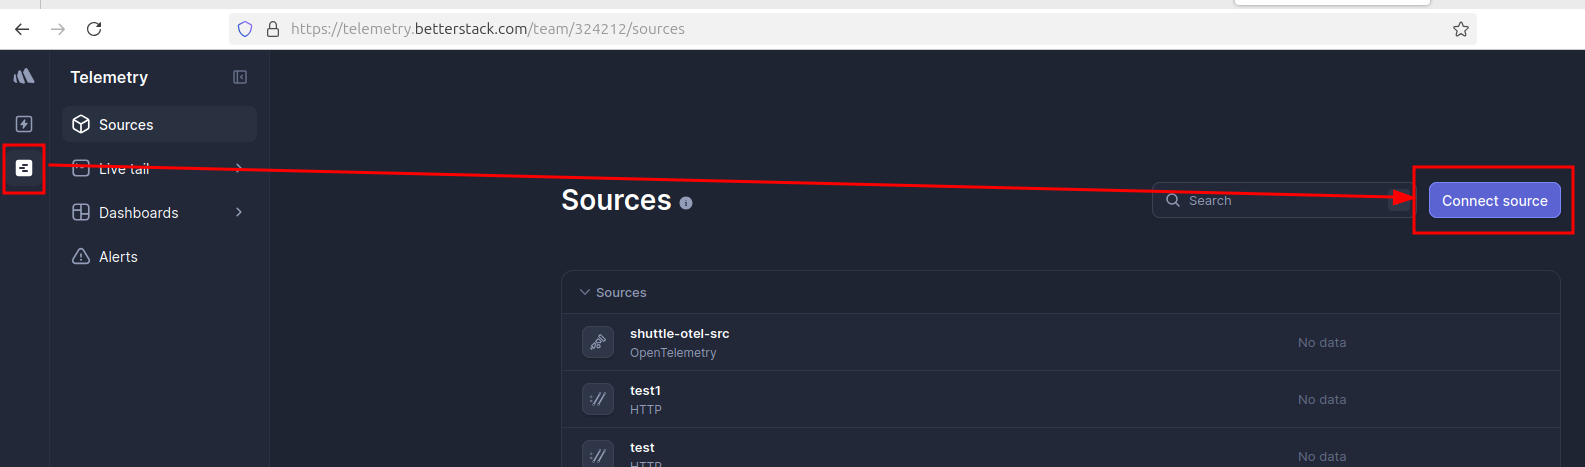
The first thing you’ll need to do once you’ve logged into BetterStack is to click onto the Sources section, then go to Connect Source which will allow you to add a new telemetry source for BetterStack.
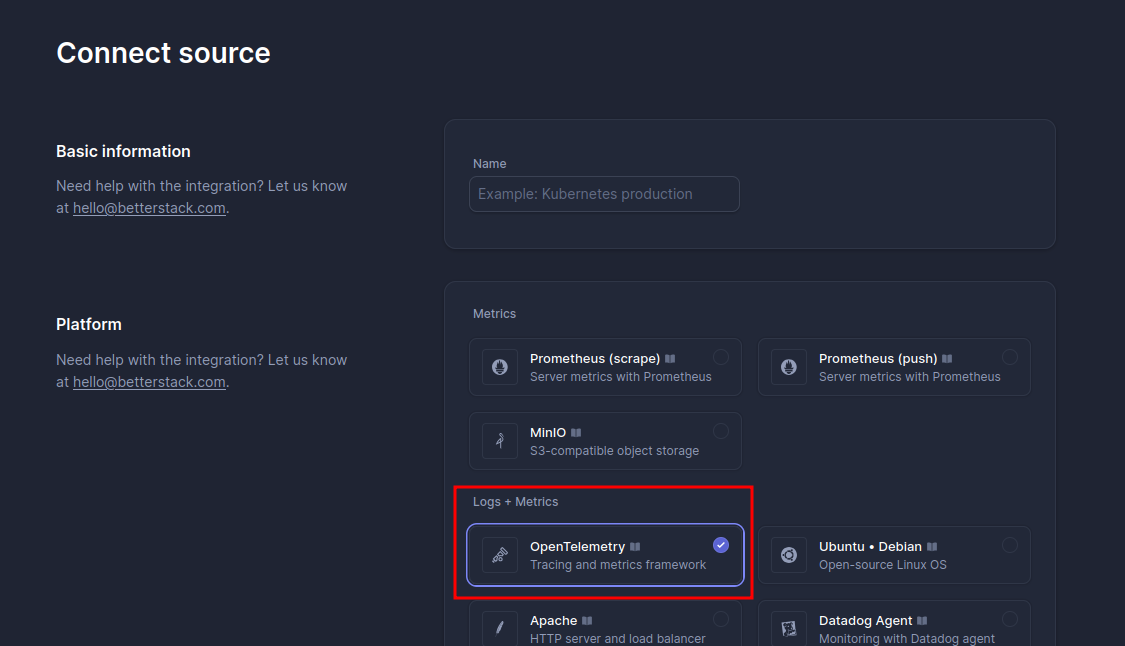
Once you’ve chosen a name for your new telemetry source (we generally use the project name, but you’re free to use any name you’d like), click the OpenTelemetry option in the “platform” section:
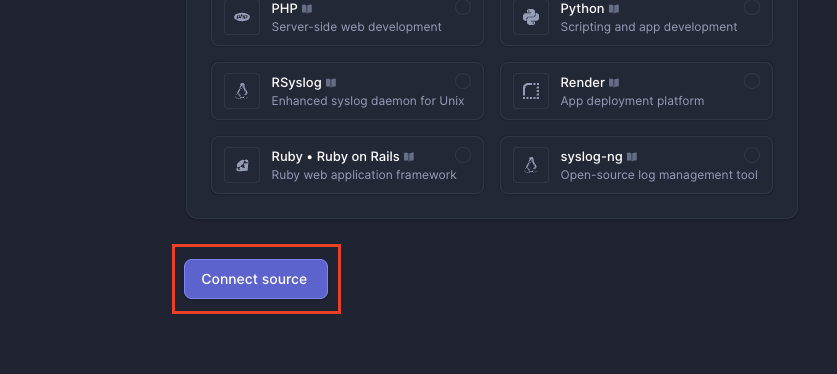
Once done, scroll all the way to the bottom of the page and hit the “connect source” button:
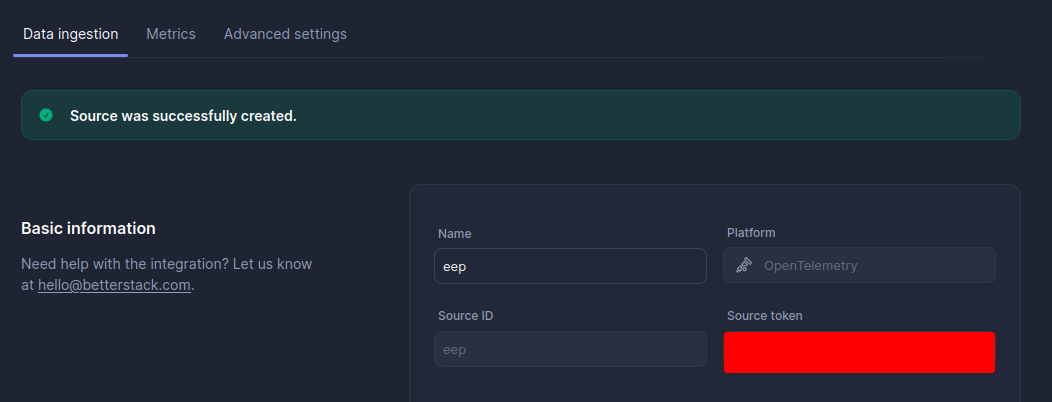
Next, grab the source token from the new menu (note that if you just click on the field it should automatically copy the value for you).
Next, you’ll need to navigate to the project you want to enable telemetry for in your Shuttle console by clicking on it on the left hand side (or from the projects menu), clicking on the Settings tab, then clicking to enable BetterStack. Paste your source token in, then press Apply.
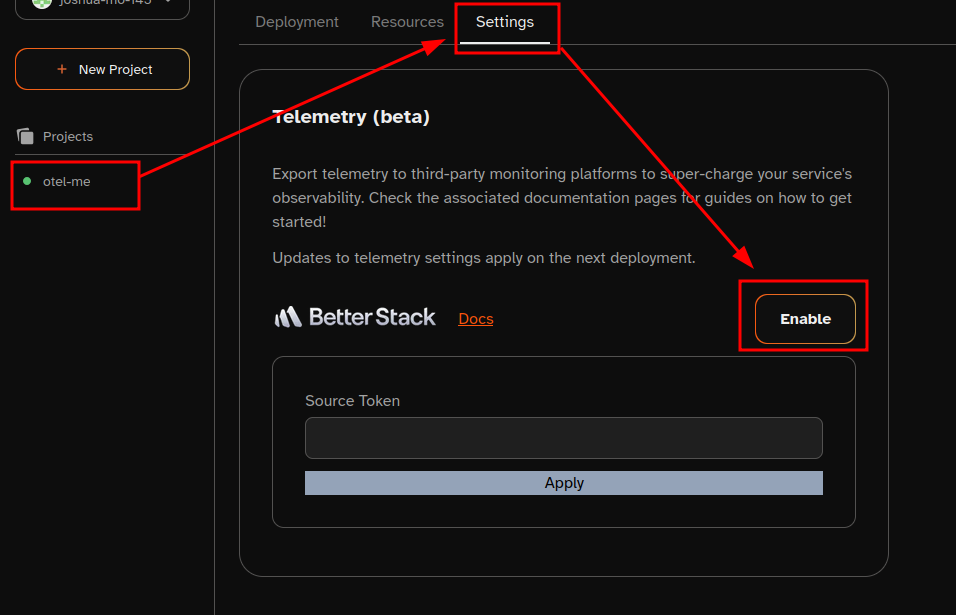
Reminder: if your project was already running when you clicked “Apply”, you’ll need to redeploy it before telemetry will start to flow. If you haven’t deployed your project for the first time yet, telemetry will start flowing immediately when you do.
Done! Now let’s talk about how to use the telemetry export.
How to use the telemetry export
Shuttle by default sets up a tracing_subscriber that will automatically log information to stdout. Now that you’ve set up BetterStack, we’ll need to tell it to also send telemetry data to BetterStack. To get started, you’ll need to add the setup-otel-exporter feature to shuttle-runtime . You can do this by running the following command:
cargo add shuttle-runtime -F setup-otel-exporter
Optionally, you can manually adjust the dependency in your Cargo.toml if you prefer:
shuttle-runtime = { version = "0.52.0", features = ["setup-otel-exporter"] }
Next, you’ll need to ensure your project has tracing as a dependency as well. As before, you can add it with cargo:
cargo add tracing
Optionally, you can manually add it as well, just be sure to check crates.io for the most recent version.
Once you have tracing available in your project, all you need to do is add some tracing to the functions you’re using. Like so:
async fn hello_world() -> &'static str {
    tracing::info!(counter.hello = 1, "Hello world from OTel!");
    "Hello, world!"
}
Doing this will send an info level log to stdout, as well as BetterStack, saying Hello world from OTel!. The log object in BetterStack will look something like this (note that log exports are a Pro feature):
{
    "attributes": {
        "code.filepath": "src/main.rs",
        "code.lineno": 4,
        "code.module_path": "otel_me",
        "counter.hello": 1
    },
    "dropped_attributes_count": 0,
    "dt": "2025-02-04T15:56:27.068644985Z",
    "message": "Hello world from OTel!",
    "observed_timestamp": "2025-02-04T15:56:27.068649239Z",
    "resources": {
        "service.name": "otel-me",
        "service.version": "0.1.0",
        "shuttle.deployment.env": "production",
        "shuttle.project.crate.name": "otel_me",
        "shuttle.project.id": "proj_01JK8SHBZQ0XF0TKW0EDWBJ8NH",
        "shuttle.project.name": "otel-me",
        "telemetry.sdk.language": "rust",
        "telemetry.sdk.name": "opentelemetry",
        "telemetry.sdk.version": "0.27.1"
    },
    "severity_number": 9,
    "severity_text": "INFO",
    "source_type": "opentelemetry"
}
You can additionally see here that we have added a counter - because we use tracing-opentelemetry under the hood, Shuttle supports three types of metrics you can use: monotonic counters, counters and histograms. You can find more about this on the tracing-opentelemetry docs.
Creating Betterstack dashboards from OTel data
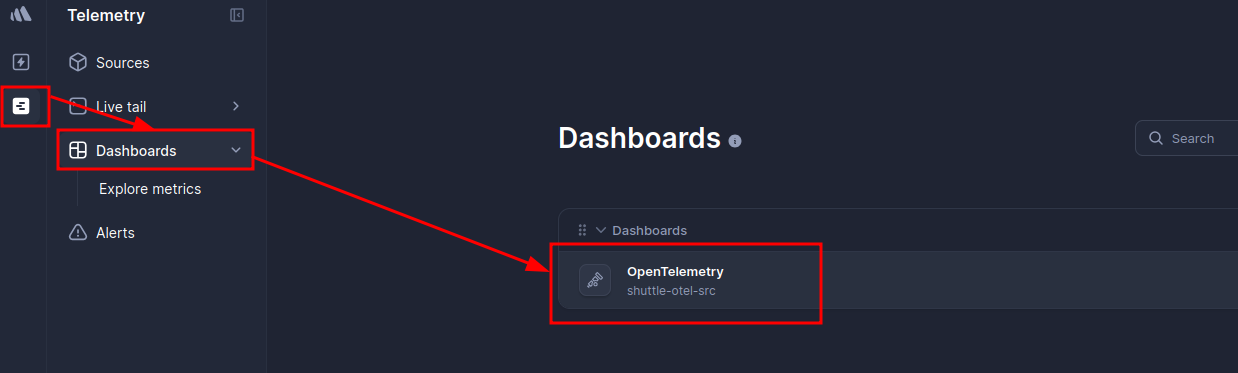
Now that we’ve done the hard part, we can create some dashboards from the data. If you go back to the telemetry section of the BetterStack dashboard, you can check out Dashboards where a new dashboard will have been created for you automatically. You can check out the dashboards like so:
Next, you’ll see some dashboard widgets that have been automatically created but will likely show “empty” (they’re generic and assume the metrics being visualized are actually the internal metrics of an OpenTelemetry collector instance, which your project is obviously not 😅).
The default view for configuring widgets is SQL, but BetterStack also offers:
- metrics-from-filtered-logs
- promql (beta)
- a visual drag-and-drop interface
Note: Naturally, you’re free to use the method that suits you best, but we generally recommend the drag-and-drop interface.
Check out how we created our own graph to measure CPU usage by adding in cpu_usage_vcpu against our project name. We’ve also set the Y axis to use vCPU units.
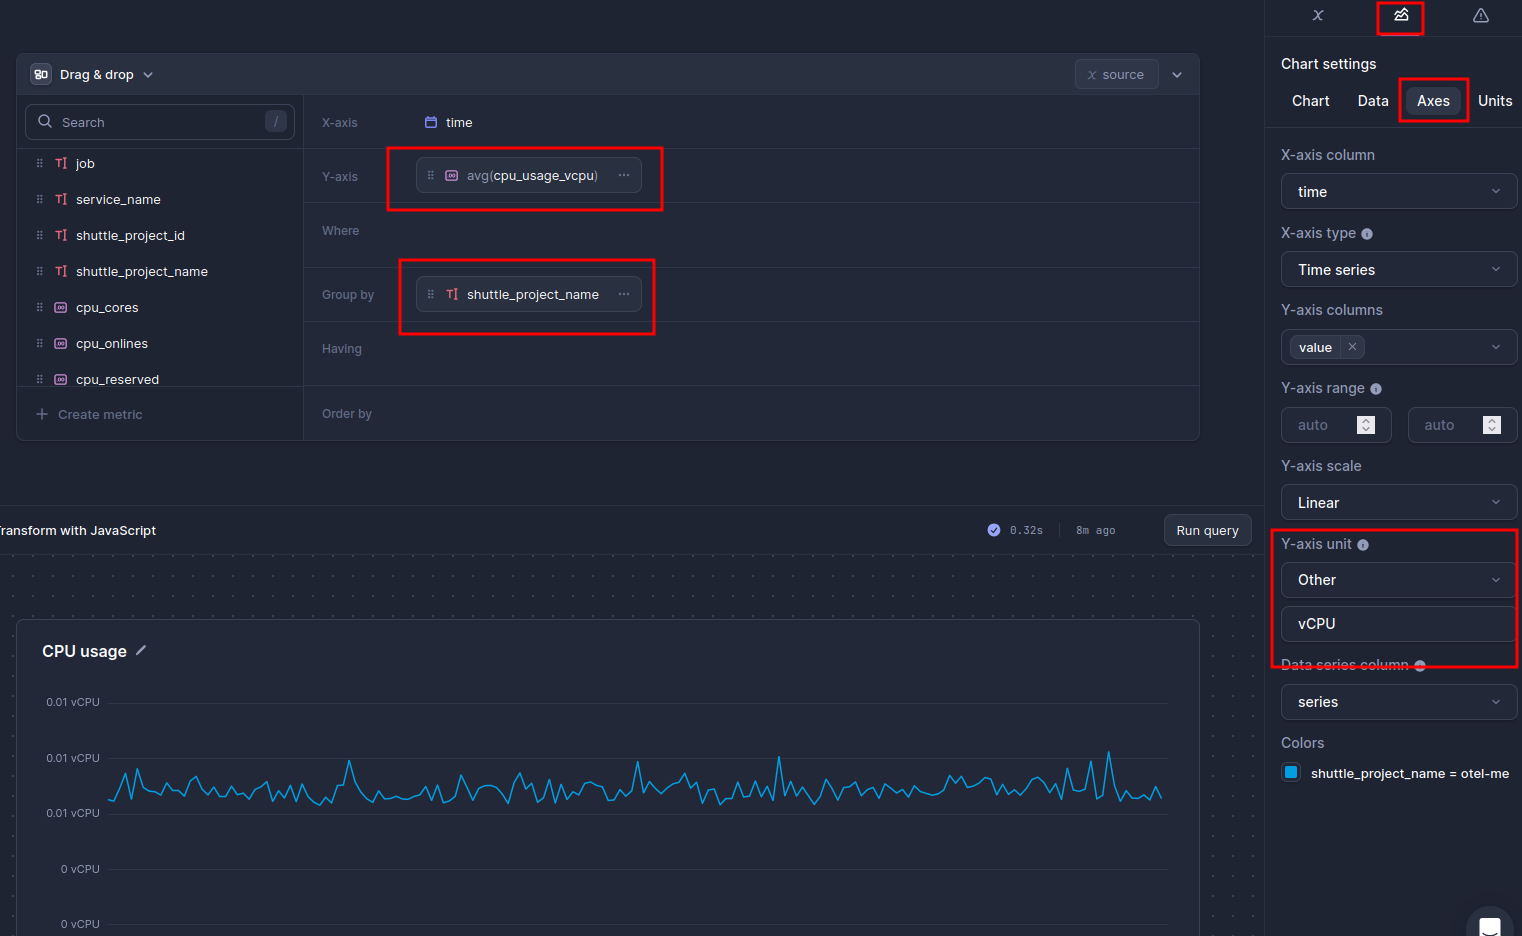
You can also additionally find out more about what other values you can use by checking out our API reference.